The Tactical Influence of Analytics in Soccer
Hugo Rios-Neto's first blog post at Footure, providing a brief overview of the current landscape in Soccer Analytics (this was completely new in Brazil at the time) & presenting a use case of the Pitch Control metric in evaluating decision-making.
Disclaimer
This blog post is a translation from a blog post I wrote in Portuguese for Footure in 2020, using concepts I had learned from Friends of Tracking. The point in translating the content was not to make it better & more adequate to my knowledge & understanding today, but rather have an exact translation of how I wrote it back then.
Você conhece a métrica de “controle do espaço”? Ela foi criada por William Spearman, cientista de dados do Liverpool para tentar quantificar o controle de espaço no campo. O analytics já é realidade na NBA e, agora, como ele pode influenciar no futebol?https://t.co/5MldTLGCVY pic.twitter.com/E9Ghvio4b1
— Footure (@FootureFC) May 23, 2020
Introduction

During the quarantine, David Sumpter, an English professor and researcher at the University of Uppsala, Sweden, assembled a group of experts in analytics applied to soccer. Through a YouTube channel called Friends of Tracking, they aimed to make the techniques used in research accessible to the general public.
Some of the group members are William Spearman (chief data scientist at Liverpool), Javier Férnandez (chief data scientist at Barcelona), Sudarshan Gopaladesikan (chief data scientist at Benfica), Ravi Ramineni (analytics director at Seattle Sounders), Devin Pleuer (chief data scientist at Toronto FC), Laurie Shaw (professor at the Institute for Theory and Computation at Harvard), Jan Van Haaren (researcher at KU Leuven, a university in Belgium), among others.
They are all leading figures in the field of analytics applied to soccer, an interdisciplinary area that combines techniques from computer science, statistics, mathematics, and physics. Compared to American sports, soccer still lags behind in terms of analytics development, and one of the goals of this initiative is to bring more people into the ecosystem.
After a few weeks of content on the channel, David Sumpter proposed a challenge:
To prepare a quantitative analysis of how Liverpool scores goals, using some of the techniques taught by them on the channel. Optical tracking data of 19 goals scored by Liverpool in 2019 were made available.
Contextualization
There are two main types of data that can be collected in soccer matches: event data and optical tracking data.
Event data represent events that occur during the match (pass, shot, block, etc.). This means that for every event that occurs, the type of event, location, and the player who carried it out, among others, are recorded. The more detailed this data, the greater the analytical capacity. Event data is currently the most common in soccer, with many suppliers and coverage that spans various leagues around the world. However, they have a significant limitation, as the annotations are restricted to the agent of action. Thus, much relevant information for analysis is lost, as decision-making in soccer involves interpreting everything that occurs on the field at that moment.
The second type of data, optical tracking, solves exactly this problem, as it records the location of all players on the field at every moment of the match. This record is made using computer vision techniques, an area of computer science that deals with image recognition. Thus, it is possible to perform a quantitative analysis without losing the context of what is happening on the field. Unlike event data, tracking data does not yet have extensive coverage. Some leagues, like MLS (Major League Soccer), have their own providers for this type of data, but in most cases, the club itself has to seek the service. I believe no Brazilian club uses this technology yet. With increasingly rich data, the trend is to deepen knowledge about the game and develop new ways to evaluate players’ actions and teams in general.
Some metrics for event data are already well established, such as xG, or expected goals. The xG is a value between 0 and 1 that tries to predict the probability of scoring a goal from that location. An xG value near zero indicates that it is almost impossible for a goal to be scored from that location, while an xG value close to 1 means the chances are high. Like any prediction model, it has its limitations.
For the analysis of the game through tracking data, William Spearman developed a metric called Pitch Control, which tries to quantify the control of space on the field. A player’s Pitch Control in a small area of the field is the probability that this player will control the ball if it goes to that space. This allows us to answer a relevant question when analyzing the game: which team or player would control the ball if it were to go to an area of interest? Pitch Control is a predictor of the next team in possession if the ball goes to the area under analysis. A simple solution would be to assume that the player closest to the ball would get possession. However, this is not necessarily correct, as one player may be closer but moving in the opposite direction to the ball, and another further away but moving towards the ball.
The calculations made by Spearman to find out how long each player takes to reach the ball take into account position, direction, speed, acceleration, and maximum speed of the players. Generally speaking, the team closest to the possible new location of the ball and with more players near it will have a higher probability of acquiring possession if the ball is passed there.
The value of Pitch Control is a continuous variable ranging from 0 to 1, which represents the probability of the team in possession remaining in possession. A Pitch Control value of zero means that the team with possession has a zero probability of controlling the ball if it goes to that space, that is, the team without possession would get the ball. The opposite is also valid — a Pitch Control value of one means that the team with possession has a one probability of controlling the ball if it goes to that space, that is, it would continue with it.
If the Pitch Control was 0.7, for example, the probability of the team in possession keeping it is 0.7, and its complement, 0.3, of losing it. To calculate the Pitch Control for the entire field, you need to divide the field into equal small spaces and calculate the Pitch Control for each one of them. The size of the spaces is arbitrary, and smaller spaces imply that more calculations will be needed to generate the Pitch Control over the whole field.
In this analysis, I divided the field into squared grids with 2.1m sides, generating a 50×32 matrix. The Pitch Control value in each position of the matrix corresponds to the color that will be overlaid on the generated field. By calculating the Pitch Control for the entire field, you can see areas where one team or the other would have a higher chance of controlling the ball, and other areas where both teams have a similar probability of getting the ball. I will call the graph below a Pitch Control Map (PCM).
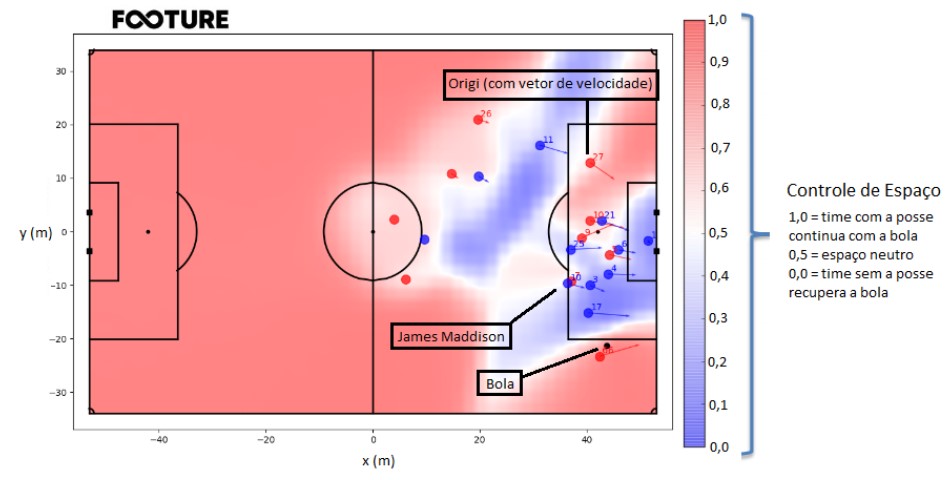
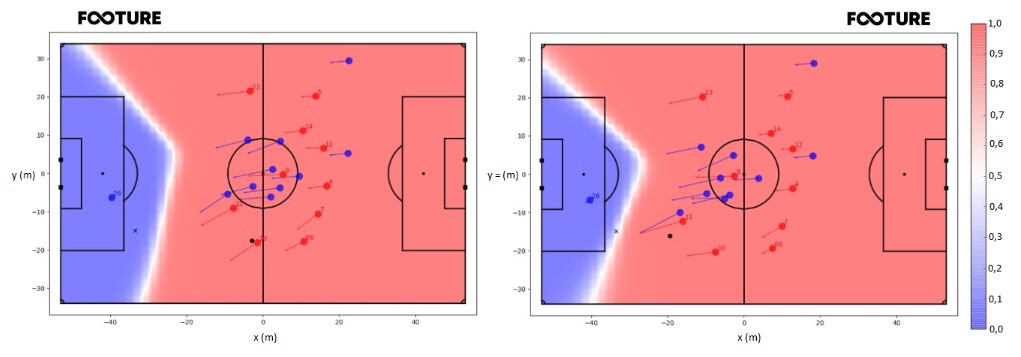
The above example will aid in understanding the concept. Each player has a position, given by the x and y coordinates, in meters, from the center of the field, which is the coordinate (0, 0). All players have a speed (which can be zero), represented by the arrow that comes out of them (players with zero speed do not have an arrow). Each space on the field has a Pitch Control value from zero to one, which indicates who would control the ball if it went there. The scale helps interpret these spaces. The example below is the moment when Alexander Arnold makes a low cross for Firmino to score Liverpool’s third goal against Leicester, in the game played on 12/26/2019. The players’ numbers correspond to their jersey numbers.
Analysis
Upon watching the 19 goals, it is noticeable how Liverpool likes to exploit the space left behind the last line of defenders, with Salah and Mané, whether the opponent is in a high defensive block or in a counter-attack situation. However, it seems that if the opposing goalkeepers had positioned themselves better in some of the plays, the passes could have been cut off.
Neuer vs. Mané
The first goal to be analyzed is Liverpool’s first in the second leg of the 2019 Champions League quarter-finals, scored by Mané. The video below shows the evolution of the play, from Van Dijk’s launch to Mané’s finish, bearing in mind that the available data does not have the location of all players at the same time, so goalkeeper Alisson does not appear.
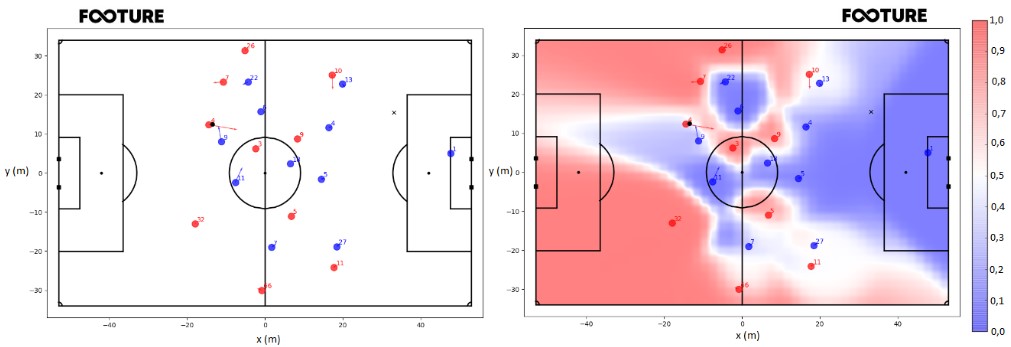
Let’s analyze the play at the moment when Van Dijk attempts the pass. On the left (Figure 2), is the players’ arrangement at the time of the pass and, on the right (Figure 2), the Pitch Control Map of the moment. The ‘X’, on the fields, represents the place where Mané received the pass. The Pitch Control value at the reception location is 0.098, that is, Bayern had a 0.902 probability of recovering the ball, while Liverpool had a 0.098 probability of keeping it. This means that Liverpool maintaining possession after the pass was an unlikely event that ended up happening.
In my view, the player most capable of cutting Van Dijk’s launch was Neuer, who was facing the field, had a good notion of which spaces the attackers could use to attack in depth, and could anticipate this. To find out the field space that the German goalkeeper controlled, I calculated the MCE, considering that Neuer was the only Bayern player with the possibility of gaining control of the ball, against the whole Liverpool team. Thus, the MCE shows the area where Neuer would have a Space Control advantage over the Liverpool team, i.e., a region where he could arrive before any Liverpool player.
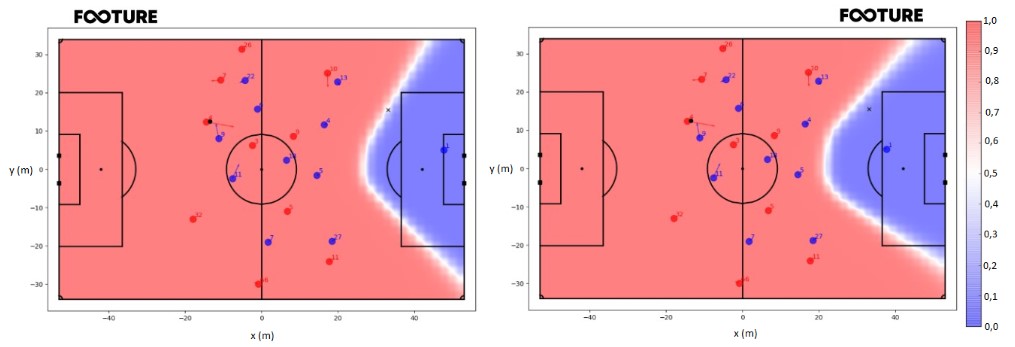
The PCM on the left (Figure 3) describes the situation from the previous paragraph. At the location where the reception happened, where the ‘X’ is, the Pitch Control value is 0.733, indicating that Liverpool had a 0.733 probability of keeping the ball, while Neuer had a 0.267 probability of intervening. However, when calculating the PCM with Neuer 10 meters ahead (change of -10 meters in the x-axis coordinate), the situation is completely different.
By being close to places where passes could be played to, Neuer could get there faster and interfere with the play. The Pitch Control value at the ‘X’, in the situation on the right, is 0.060. Thus, the probability of Liverpool retaining the ball, with Neuer 10 meters ahead compared to the original position, would be 0.060, while the probability of Neuer intervening would be 0.940. In addition to increasing the Pitch Control value at the place where Mané received the ball, the area that Neuer would control is clearly larger, indicating that he would also be better prepared to intervene, should the pass go elsewhere.
When thinking about the goalkeeper’s positioning when the opposing team has possession and their defense is in a higher block, it seems intuitive to me that the goalkeeper should ty to control as much space as possible behind his defensive line, without failing to protect the goal. This new suggested position (-10 meters on the x-coordinate and no change on the y-coordinate) is not necessarily the best, but already indicates a significant improvement compared to the original position.
The next step, in future work, is to try to optimize the goalkeeper’s position, so as to know from which place he could the largest area on pitch, without failing to control the goal, which is his main function. Thus, it would be possible to reach the ideal goalkeeper positioning location. Of course, for a more accurate model, it would be necessary to take into account different speeds and maximum accelerations of the players (for example, Mané is faster than Neuer), as well as body orientation (in this sense, Neuer would have an advantage, for being facing the play), as both affect the time each player would reach a field space.
Forster vs. Salah
Having good positioning only at the moment of the pass attempt is not enough to intervene in the play. The interpretation of which spaces to control is continuous. This becomes evident in Liverpool’s first goal over Watford, a match played on 12/14/2019. The video below shows the development of the play, which ended up being concluded in a goal.
Firstly, I calculated the general PCM at the moment when Mané makes the pass (Figure 4) to try to better understand what was happening on the field. As in the previous figures, the ‘X’ indicates the place where the reception was made. Again, the place where the pass is dominated by the Liverpool player is under the control of the defense, which leads me to try to explain how Salah managed to get to the ball first. At the ‘X’, the Pitch Control is 0.002. With this, the probability of Liverpool continuing with the ball is 0.002 and of Watford recovering it is 0.998.
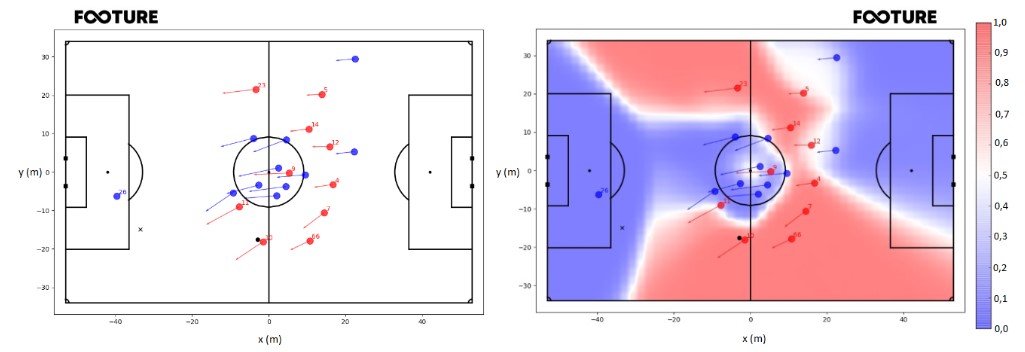
As in the game against Bayern, it seems to me that the goalkeeper is the player most apt to intervene in the play, as he is facing the play and significantly closer to the ‘X’. Therefore, I calculated the PCM of Watford’s goalkeeper Foster against the entire Liverpool team, as in the Neuer x Liverpool case, to check over which spaces he had greater control compared to the Liverpool team. Thus, I obtained the PCM on the left (Figure 5). The Pitch Control at the ‘X’ is the same as when calculated considering all players on the field, 0.002. This allows us to conclude that the Space Control model, in fact, expects Foster to be the player to intervene in the play, while the other defense players interfere little in the control of that space.
Having a probability of 0.998 of controlling the space at ‘X’ at the time of the pass, it is unclear why the goal happened. To try to better explain, on the right (Figure 5), I calculated the PCM exactly one second after the pass was made. It becomes clear that Foster failed to interpret the pass as a great chance to recover the ball. By remaining virtually static compared to the previous second, Foster allowed the Pitch Control at ‘X’ to change completely. In this second situation, the Pitch Control was 0.604, indicating that Liverpool had a probability of 0.604 of keeping the ball, while Foster had a complementary probability of 0.396 of making an intervention.
It would be possible to analyze the positioning of goalkeepers in some other Liverpool goals, but I limited myself to these two for this text. The introduction of the concept of Space Control allows us to analyze the game in a quantitative way, considering the spaces supposedly available for both teams to explore, a fact that was limited to the analyst’s intuition when there were not enough tools for that. There are an infinity of possible ways to explore Pitch Control, and I explored just one of them in the text.
Conclusion
The main objective was to present a little of the world of analytics in soccer, to bring the concept of Space Control (currently in great evidence) and, finally, to analyze how this applies to the game and what conclusions we can draw. Optical tracking data bring real possibilities of impact on the tactical part of the game, translating into competitive advantage. This is already a reality in the NBA, where some teams, besides having a department dedicated to analytics, have members of the technical commission who came from this department. Soccer still needs to follow the same path.